
 XTB integration
XTB Trading Journal
The xStation 5 account statement reaches your journal in a few clicks, XLSX included, with nothing to convert beforehand.
- Free for your first 25 trades
- No credit card required
- No access to your XTB account, you upload the file yourself
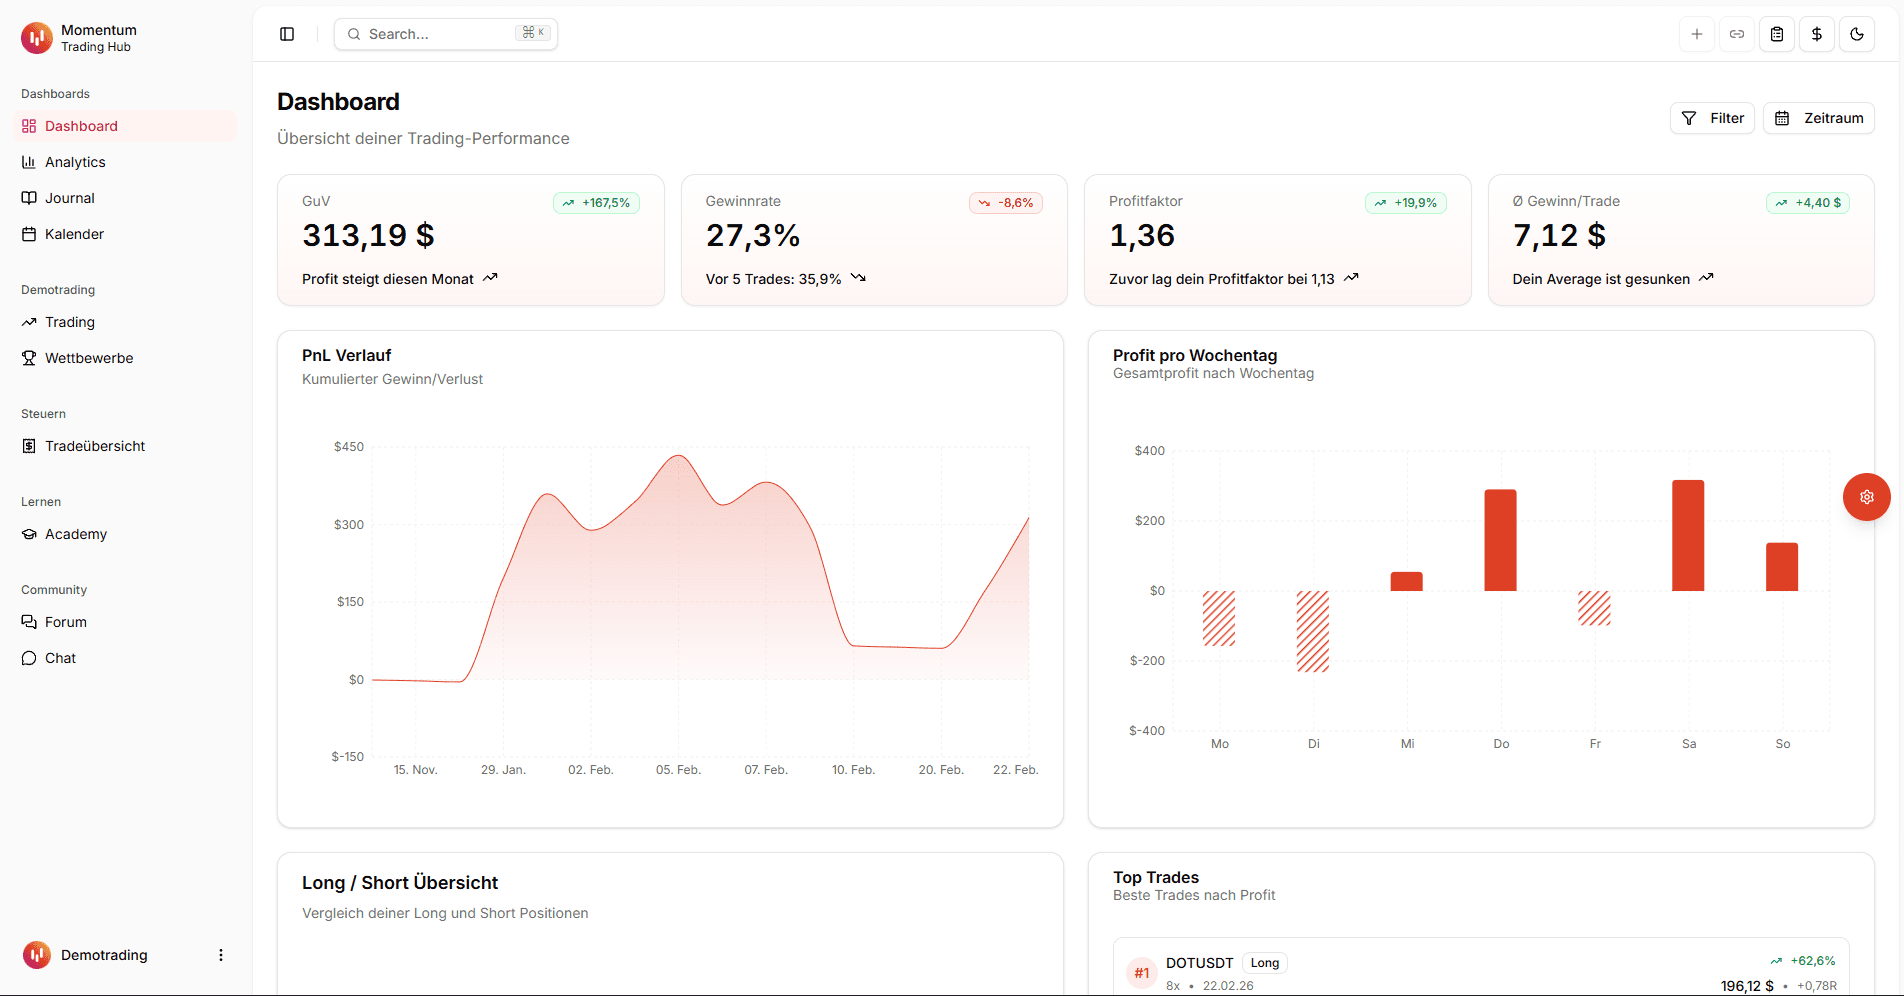
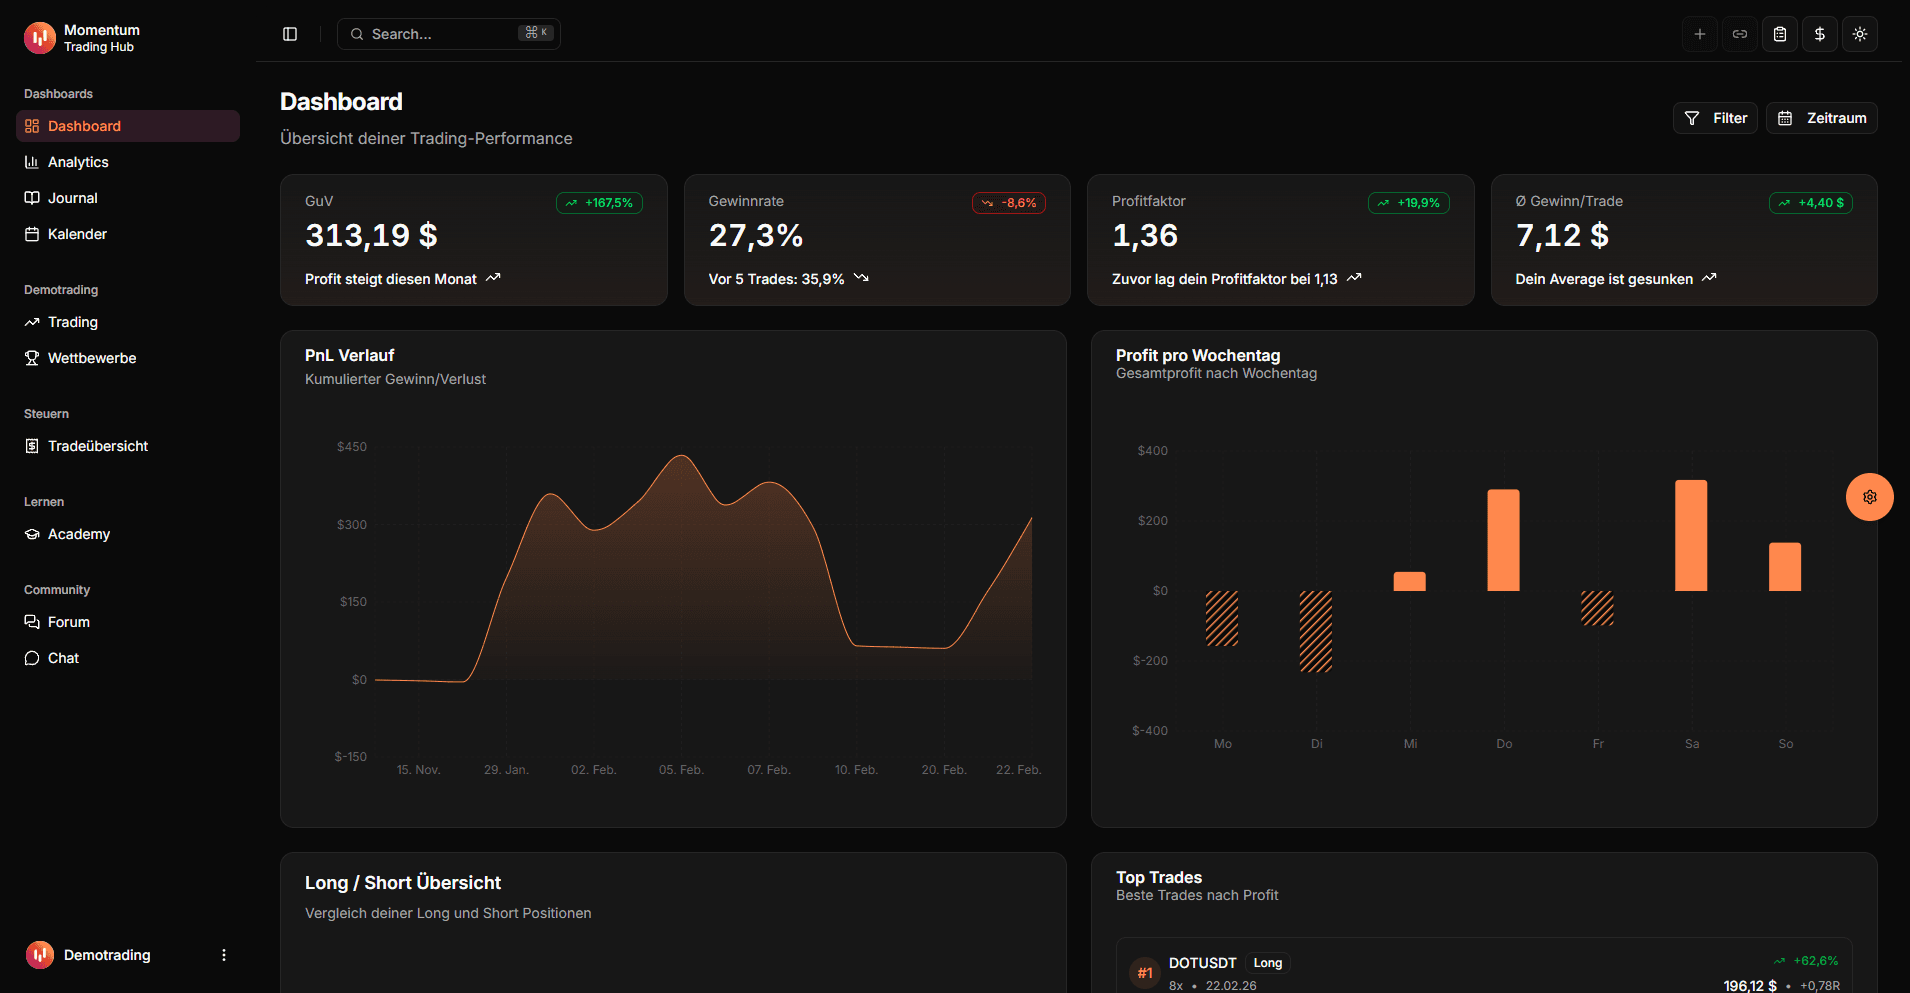
Can you import your XTB trades?
Yes, through the account statement from xStation 5. You create a report for the period you want in the account history section and upload it. The importer reads the "Closed Positions" sheet, where each row is one completed position.
XTB delivers this report as XLSX rather than CSV. That is not an obstacle: the importer reads the file directly, so you neither open nor convert it first. A CSV version of the same report works just as well.
XLSX read directly
The xStation report is parsed without conversion, and CSV works too.
No credentials
You generate the report yourself. No API key, no account access.
Timestamps in UTC
Unambiguous timestamps, correctly converted into your timezone.
How to export your account history
Everything happens inside xStation 5, since XTB offers no API connection. For your first import deliberately pick the full period; later reports can be limited to new sections.
Create the report in xStation 5
The account history sits in the xStation 5 menu. From there you create a new report through the export mode, pick your period and download the generated file.
- 1
Bei XTB (xStation 5) anmelden
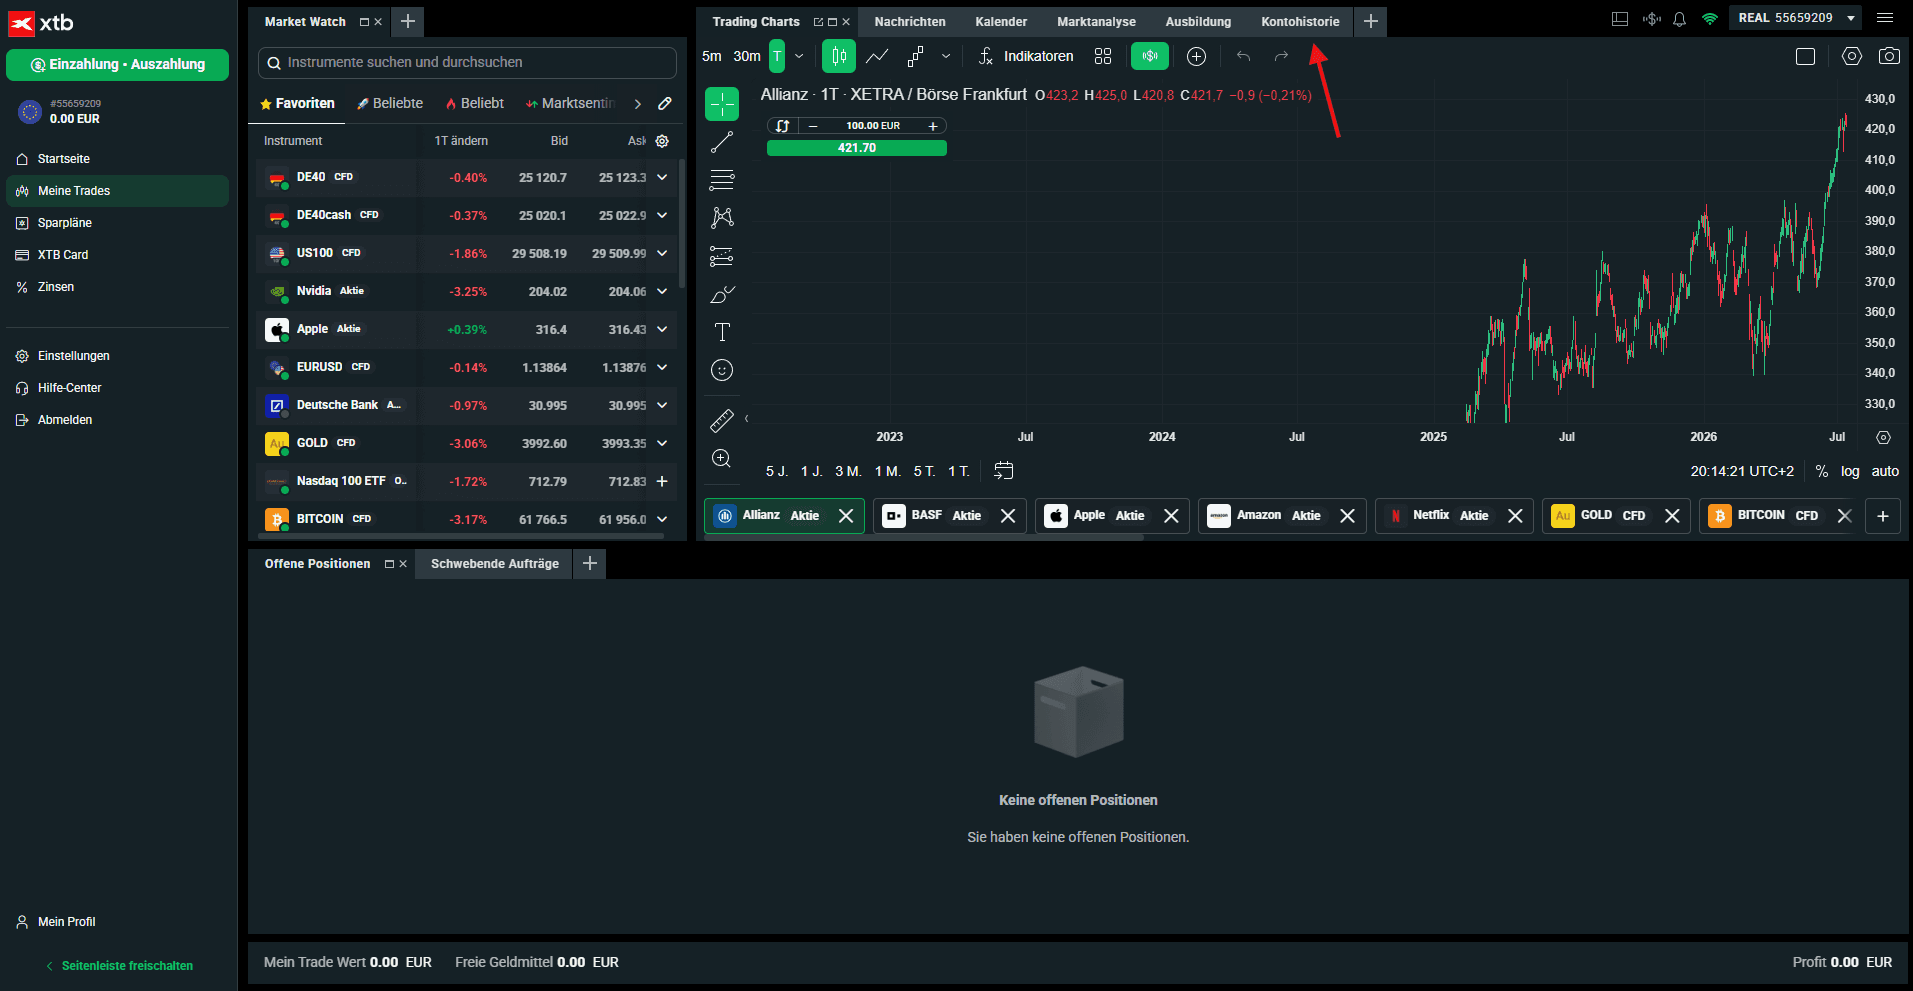
Du befindest dich bereits in xStation 5. Öffne über das Menü den Bereich "Kontohistorie".
- 2
Kontohistorie öffnen
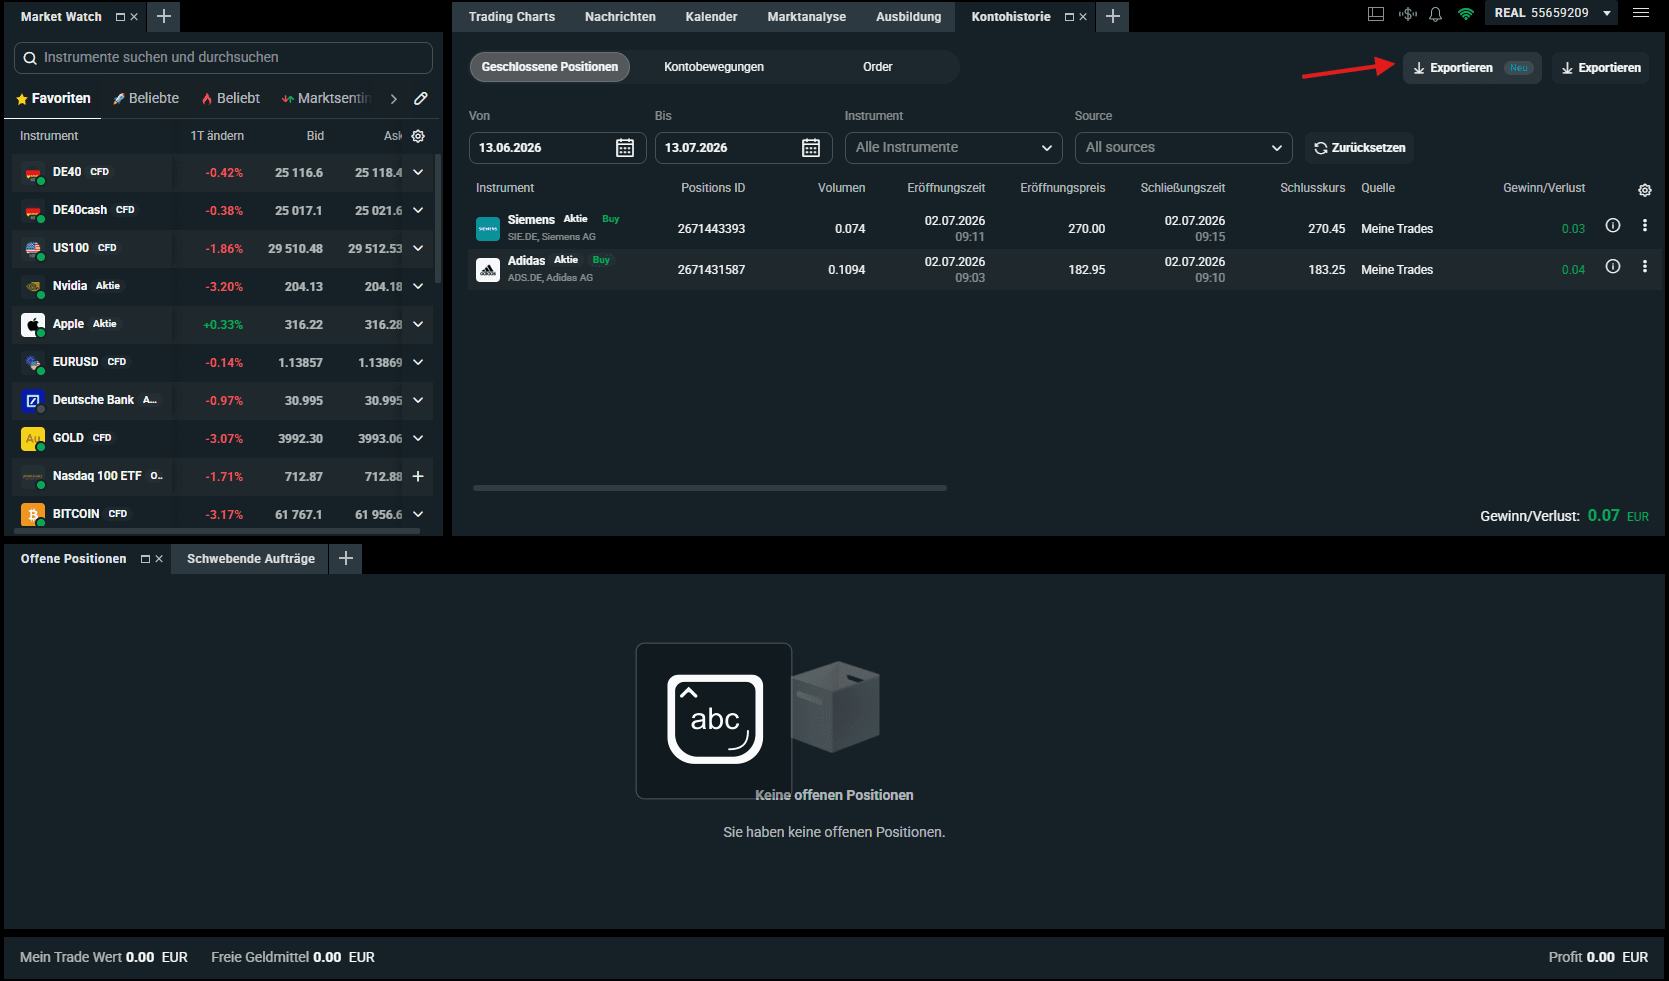
Klicke dort auf den neuen Export-Modus "CSV".
- 3
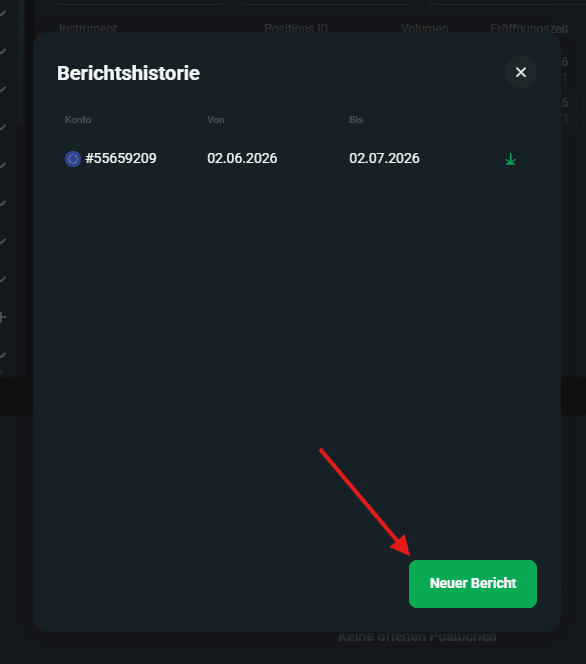
Neuer Bericht erstellen
Klicke auf "neuer Bericht"
- 4
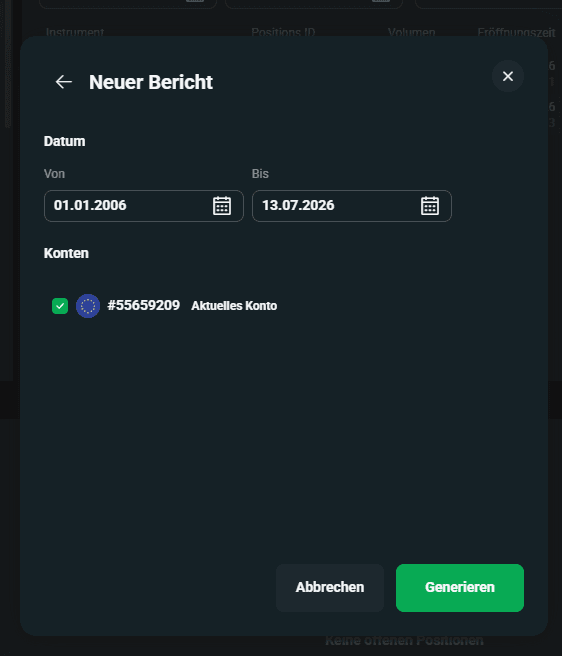
Zeitraum wählen
Wähle für deinen ersten Import den gesamten Zeitraum aus oder wähle einen Teilzeitraum und erstelle den Export.
- 5
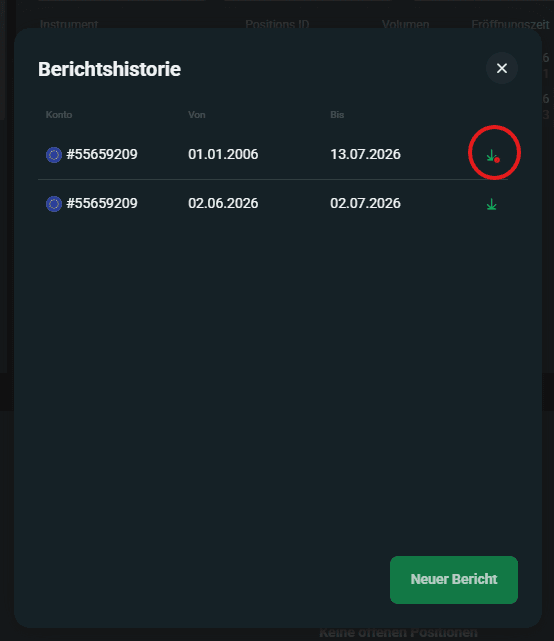
Download deinen neuen Bericht
Downloade deinen neuen Bericht und lade ihn hier hoch.
What gets imported from the report
The report contains two sheets. "Cash Operations" lists deposits and withdrawals and is not evaluated. Only "Closed Positions" is relevant.
| XTB column | Journal field | Note |
|---|---|---|
| Position ID | External ID | Basis for duplicate detection on a repeated import |
| Ticker | Symbol | Dots in codes such as SIE.DE are preserved, Instrument is the fallback |
| Type | Direction | BUY becomes long, SELL becomes short |
| Open Time (UTC), Close Time (UTC) | Open and close time | Explicitly UTC and therefore unambiguous, see the pitfalls |
| Open Price, Close Price | Entry and exit | |
| Profit/Loss | Result (net) | Not to be confused with the Gross Profit column beside it |
| Commission, Swap, Rollover | Fees | Informational only, already deducted in the result |
What to watch out for in the XTB report
The report is cleanly structured, but four quirks are worth knowing before you analyse it yourself.
XTB is the one provider with an unambiguous timezone
The columns are explicitly labelled Open Time and Close Time with a UTC suffix. That makes the timestamp unambiguous, so it is converted correctly into your timezone on import. Almost every other provider omits this, which forces the wall clock to be kept as is. Your XTB trades therefore sit more precisely in time than most others in your journal.
Profit/Loss and Gross Profit sit next to each other
The report places both columns directly in sequence. Profit/Loss is the net result while Gross Profit is the figure before costs. Pulling the wrong one into a spreadsheet of your own shows a systematically flattering performance, and the smaller your individual positions, the larger the distortion.
The sheet has header rows above the header row
Four rows carrying the account number, title and period sit above the actual column headings, and a totals row follows at the end. Open the file in a spreadsheet and select everything, and those rows join your analysis. The importer locates the real header via the Instrument column and discards the meta and totals rows.
Amounts stay in account currency
If you trade instruments denominated in other currencies, XTB still reports the result in your account currency, typically euros. Those amounts are taken as they are and never converted a second time, so the total in your journal matches your account statement exactly.
Which analysis pays off at XTB
XTB accounts often hold very different instruments side by side: share CFDs, indices, commodities and real equities. Costs and typical holding periods differ considerably between them, which is why a single overall performance figure says little.
The most worthwhile cuts are therefore by instrument and by holding period. With leveraged products, add a look at swap costs: positions held overnight quietly give back part of their result, and that stays invisible in a view built only on entry and exit.
Because XTB timestamps are unambiguously UTC, analysis by time of day is also more reliable here than at most providers. If you want to know whether your morning trades beat your afternoon ones, XTB data is the most trustworthy basis for that question in your journal.
Trading journal: What a trading journal does, which metrics matter and how it differs from a spreadsheet template.
Journal or spreadsheet
The report opens in Excel. The question is what happens after that.
| Criteria | With a trading journal | With your own spreadsheet |
|---|---|---|
| Meta and totals rows | Discarded automatically | Distort every total until removed |
| The right result column | Profit/Loss is wired in | Confusing it with Gross Profit happens easily |
| Multiple reports | Merge into one history | Every report stands alone |
| Repeated imports | Duplicates caught via the position ID | Overlaps removed by hand |
| Trade notes | Setup, mistakes and screenshots on the trade | Kept apart from the numbers |


Common questions about importing XTB trades
Supercharge yourtrading performance
Start from zero with Momentum. Use our tools to improve your trading performance.